Using Pycharm
Indices and tables
Introduction
Once you start writing anything but very simple scripts, learning to use an IDE can greatly improve your productivity in both coding and debugging Python applications. This section will provide a quick overview of the features of PyCharm, an IDE that is pre-installed on the PythonEDU VM.
Tip
One thing you will start to notice with PYCharm is that it has a huge array of shortcuts to access its features. However, you don’t need to memorize these shortcuts to use PyCharm effectively. You will slowly start to memorize the ones you find you are using frequently. The infrequently used ones can still be accessed from the main menu, the tool bar, or the context menu.
Creating A Project
PyCharm, like other IDE’s, thinks in terms of projects, which are the container for your code and the various settings and metadata that are part of it.
If the welcome screen is shown, select Create New Project.
If the IDE is shown, select File -> New Project.
This will open the project creation dialog.
Then do the following:
Select the Pure Python project template type.
Change the location to where you want to create the project (this also sets its name)
Choose your interpreter:
- By default a virtualenv is pre-selected. However, for this lesson, click the drop down arrow, select Existing Interpreter, and select one from the Interpreter drop down list.
Click Create.
Adding Source Files
If you created your project using a directory that already had source files, PyCharm would offer to add them to your project for you. However, for this lesson, there are no pre-existing source code files so let’s make one.
To add a new source file to your project, do the following:
- File -> New -> Python File
- Give the new file a name. For this lesson, call it, “plot_sin_wave.py”.
- Click Ok
For this lesson, paste the following into the editor window.
1 2 3 4 5 6 7 8 9 10 11 12 13 14 15 16 17 18 19 20 21 22 23 24 25 26 27 28 29 30 31 32 33 34 35 36 37 38 39 40 41 42 43 44 45 46 47 48 49 50 51 52 53 54 55 56 57 58 59 60 61 62 63 64 65 66 67 | import sys
import math
import time
def plot_sin_wave(freq=1.0, sample_rate=20.0, scale=20):
'''Plots a sin wave of the given frequency.
:param freq: Frequency in Hz of the sin wave to plot.
:type: float
:param sample_rate: Sample rate in Hz to plot the sin wave at
:type: float
:param scale: Number of grid points to represent the magnitude of the sin wave.
:type: int
:return: None
:rtype: None
'''
# Determine the angular frequency
omega = 2 * math.pi * freq
# Determine how often to evaluate the sin function
# based on the sample rate
time_step = 1 / sample_rate
# Determine offset to the graph center line
graph_center_offset = scale // 2
# The plotting kernel:
# 1) Evaluate the sin function
# 2) Determine how far up the graph to plot the data point
# 3) Print the data point
# 4) Pause briefly
# 5) Advance time.
print(" " * 8 + "-" * 40)
t = 0.0
while True:
sin_val = math.sin(omega * t)
spaces = int(graph_center_offset + graph_center_offset * sin_val)
print("{:8.2f}|{}*".format(t, " " * spaces))
time.sleep(time_step)
t += time_step
if __name__ == "__main__":
try:
if len(sys.argv) == 1:
# Call the plotting function with default params
plot_sin_wave()
else:
# Pass parameters from command line.
# In this case, we expect them to be in the same order
# as the call to plot_sin_wave() would expect them.
# :NOTE: Command line args come in as strings. Must convert
# them to the correct type before passing to the fn.
kwargs = {}
if len(sys.argv) > 1:
kwargs['freq'] = float(sys.argv[1])
if len(sys.argv) > 2:
kwargs['sample_rate'] = float(sys.argv[2])
if len(sys.argv) > 3:
kwargs['scale'] = int(sys.argv[3])
plot_sin_wave(**kwargs)
except KeyboardInterrupt:
print("Done")
finally:
pass
|
PyCharm UI Tour
After a project has been created the full UI becomes visible and with some source code present, we can now take a tour of the UI.
- Main menu
- Toolbar
- Projects side bar
- Structure side bar
- Console
- Terminal
- Editor tabs
- Left gutter - Line numbers
- Left gutter - Cold folding
- Left gutter - Breakpoints
- Right gutter - Lens view of errors and introspection warnings
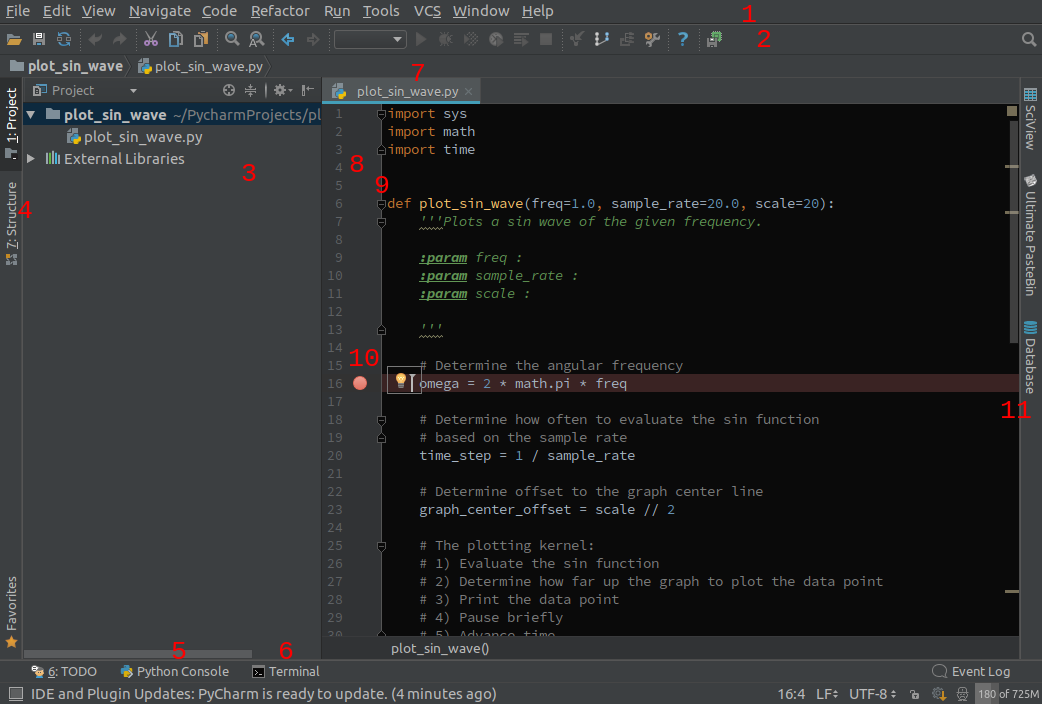
Fig. 32 PyCharm UI
Debugging An App
PyCharm includes a debugger which allows you to run your application, step through the lines of code and inspect variables in real time.
To start debugging your application, you must first create a configuration that tells PyCharm things like:
- What script you want to run
- What directory to run the script in
- What interpreter to use
- What arguments to pass the script
To create a configuration, do the following:
- Run -> Edit Configurations
- Click the “+” icon, on the upper-left of the window,2 and select Python
- Choose a name for this configuration using the name field (e.g. “plot_sin_wave”)
- Under Script path, click the button with the ellipses icon and find the plot_sin_wave.py file.
- Ensure an interpreter is selected under Python interpreter
The best part about using the debugger is being able to stop code execution at a line of code in order to inspect the variable values. To set a breakpoint, do the following:
- Inside the left gutter, click on the line you want to set a breakpoint on. A small red circle should appear.
PyCharm can execute your app in 2 ways:
- In “run” mode, by clicking run icon (the play arrow) or typing
Alt+Shift+F10. Your app executes at full speed but debugging is not possible. - In “debug” mode, by clicking the debug icon (the bug) or typing
Alt+Shift+F9.
When the debugger has stopped on a line of code (a.k.a. break mode), PyCharm allows you to view the values of the variables that are in scope in the different threads and stack frames that exist.
You can drag variables to the watch window to keep the variable visible no matter which thread or stack frame you select.
In the code window:
- PyCharm will display the value of the names on the left of any assignment statements.
- If you hover your mouse over a variable, PyCharm will display its value in a tool tip pop-up.
To continue executing lines of code, you can do the following:
- Clicking the Step Over button (or
F8), will cause PyCharm will execute the current line of code, including any function calls, and stop at the next executable statement. - Clicking the Step Into button (or
F7), will cause PyCharm to execute the current line of code and stop at the next executable statement. If the current line of code is a function call, code execution will stop just inside the function. - Clicking the Resume Program button (or
F5), will cause PyCharm to resume running your program until the next breakpoint is encountered.
Any output from your application will be sent to the Console window.